Public health, explained: Sign up to receive Healthbeat’s free New York City newsletter here.
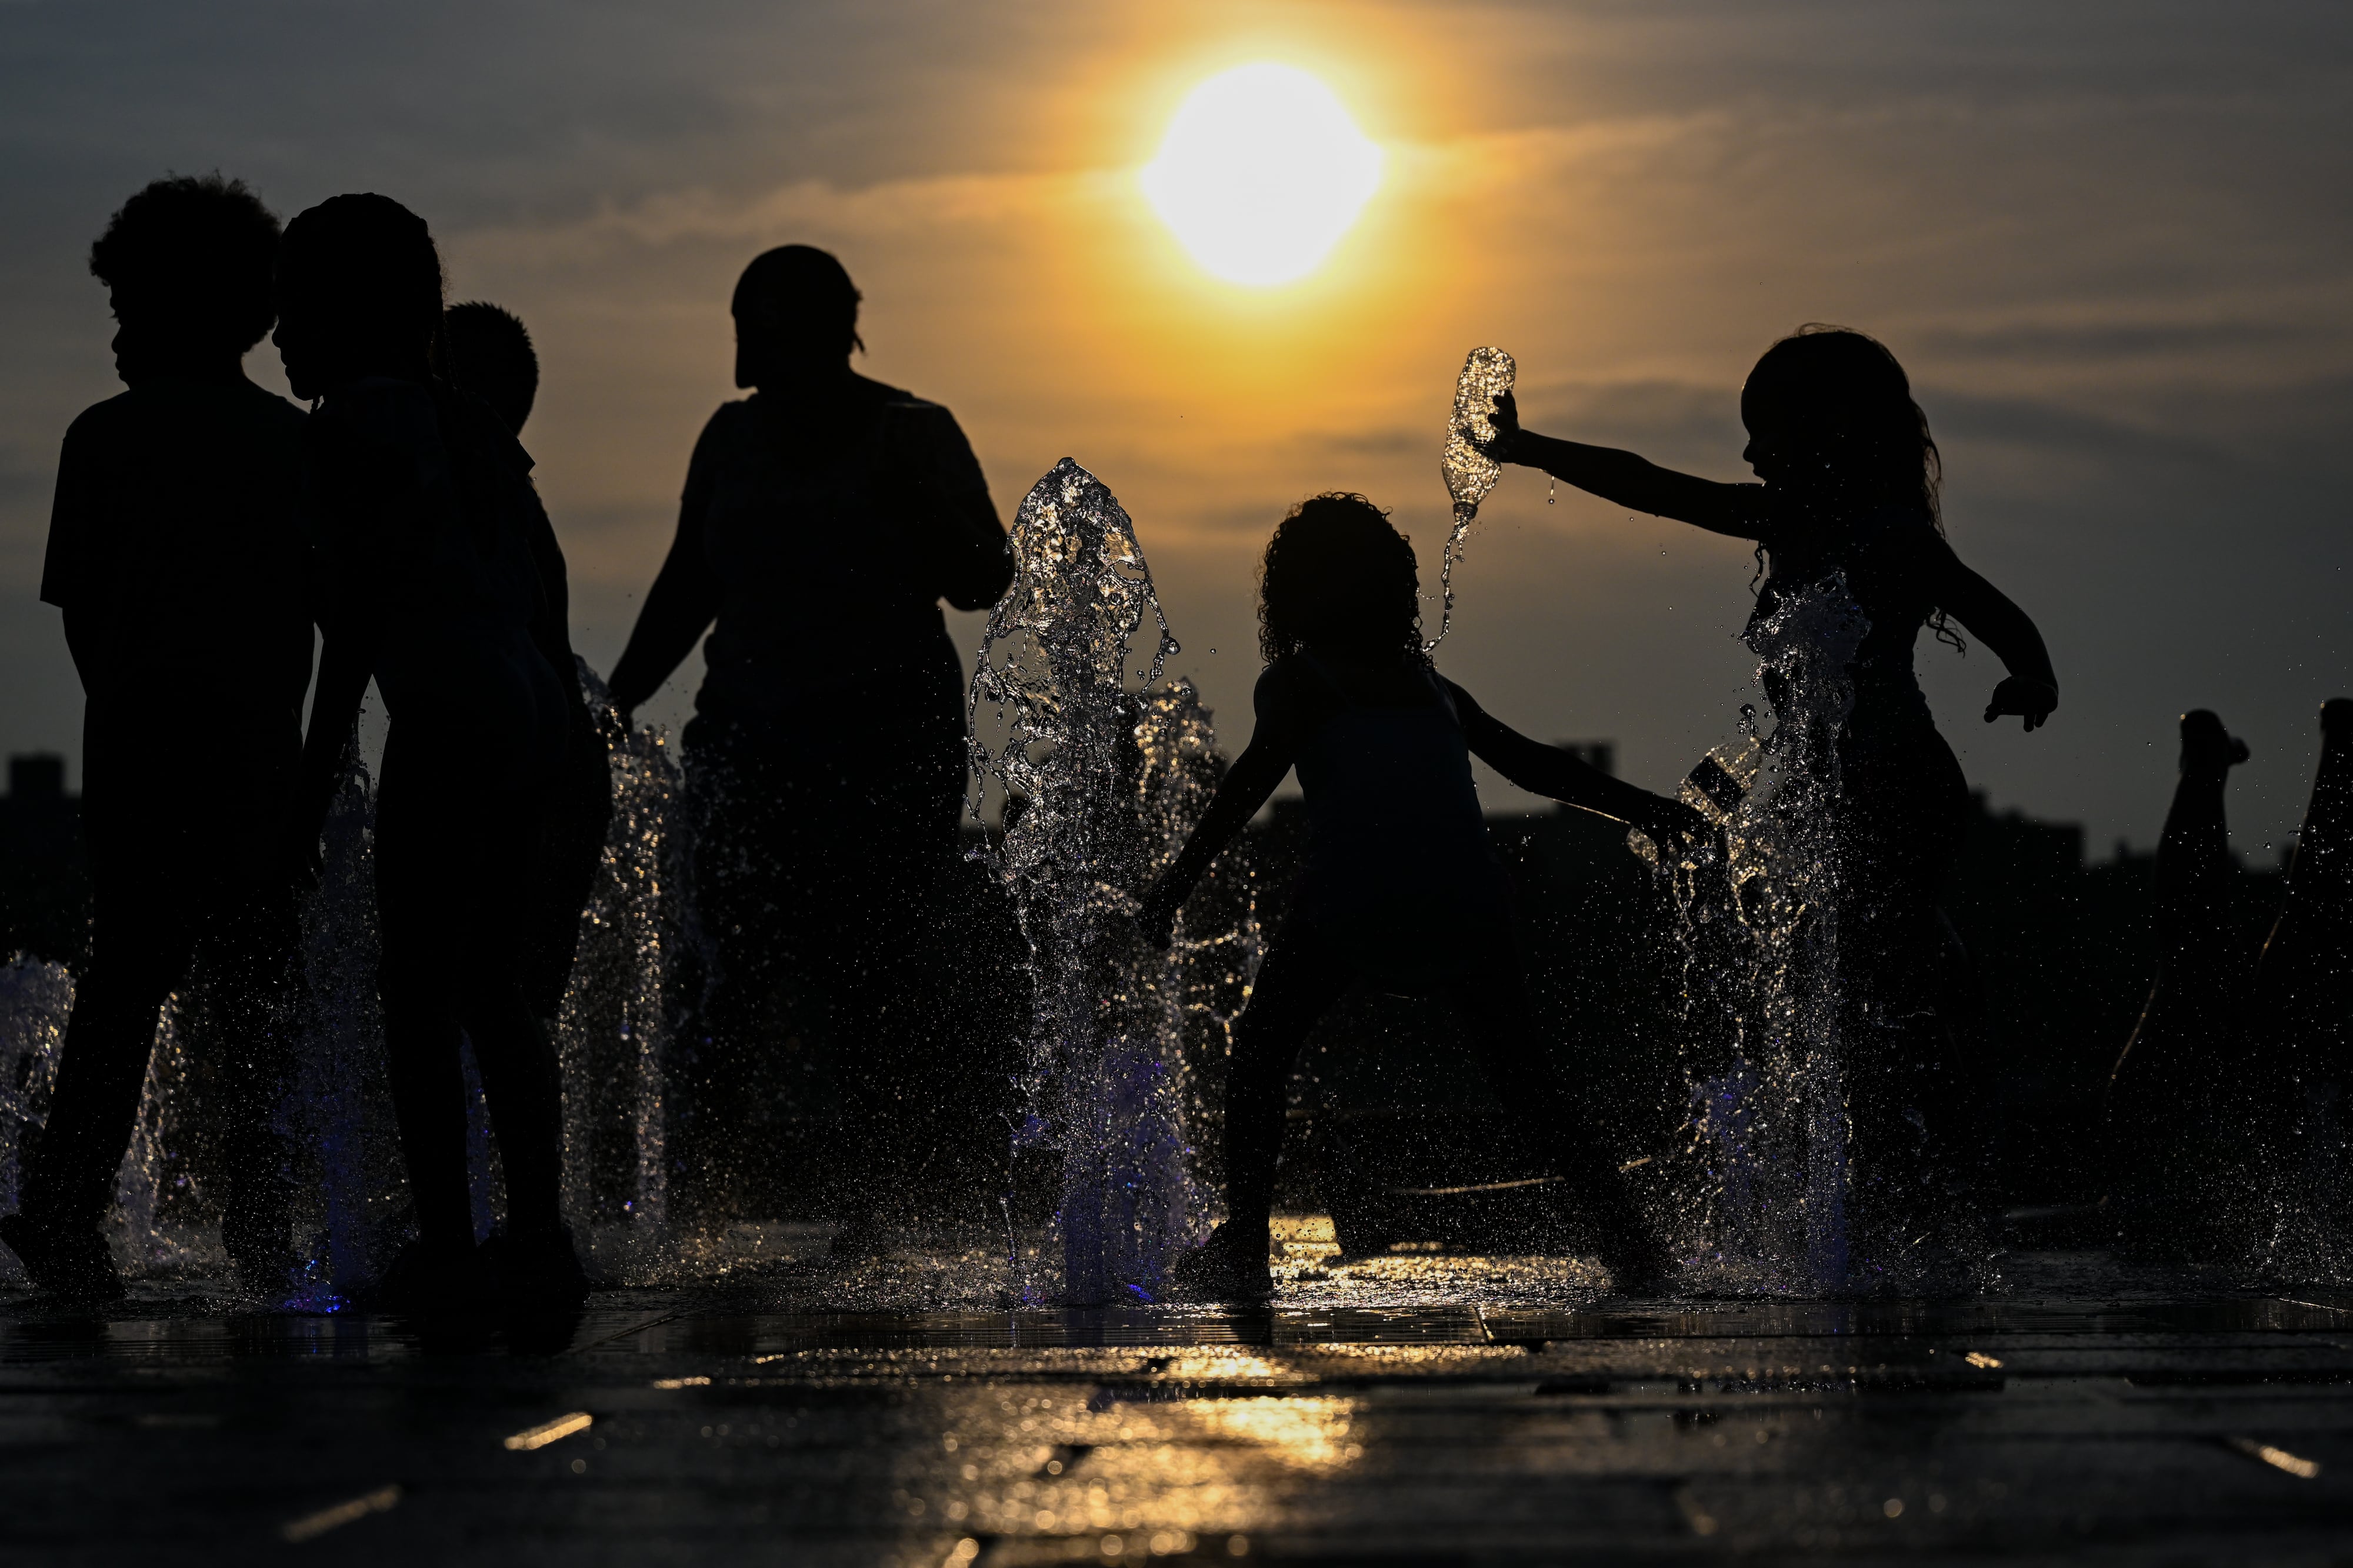
As climate change drives up temperatures and the risk of heat-related illnesses in New York, public health leaders and researchers are paying more attention to heat surveillance.
This week, the New York State Department of Health launched a dashboard that aims to help New Yorkers assess heat exposure and health risks — and guide local responses to heat waves.
“This is a new tool that will help us understand the risk hot weather presents to us,” State Health Commissioner Dr. James McDonald said in a statement. “We have moved beyond, ‘it’s not the heat, it’s the humidity’; it’s much more complicated than that, and this dashboard offers better insight into your risk.”
Since 1901, average temperatures in New York state have increased by almost 2.6°F, and since 2000, they’ve remained higher than in any period in recorded history, according to the New York State Climate Impacts Assessment. And it’s only going to get hotter from here: Average temperatures in the state are projected to rise between 5° and 11°F by the end of the century.
As rising temperatures increase the risk of heat-related illnesses, McDonald said that the dashboard will “help communities and decisionmakers — like school officials and employers – make informed choices, such as adjusting outdoor activities or opening cooling centers.”
What’s the link between extreme heat and public health?
Scientific research shows that as climate change makes summers hotter — and heat waves longer — the risk of heat-related illness rises. Extreme heat can be especially dangerous for children, elderly adults, people with chronic conditions, anyone who works outside, and those who are unhoused.
More than 700 people die from extreme heat every year in the United States, according to the Centers for Disease Control and Prevention.
The most serious heat-related illness, heat stroke, occurs when a person’s body temperature rises rapidly and cannot cool down. Heat stroke can drive body temperature up to 106°F or higher within 10 to 15 minutes, and without emergency treatment can result in permanent disability or death, according to the CDC.
Symptoms of heat stroke include confusion and slurred speech, loss of consciousness, hot skin, seizures and very high body temperature. Signs of heat exhaustion — the body’s response to excessive loss of water and salt — include headache, nausea, dizziness, weakness, thirst, heavy sweating and elevated body temperature.
Extreme heat can also worsen the effects of air pollution and exacerbate respiratory conditions. A 2012 study of extreme heat and respiratory hospitalizations in New York state estimated that from 2080 to 2099, extreme heat could lead to two to six times the number of hospital admissions for respiratory conditions than had occurred from 1991 to 2004.
Research published last year in the CDC’s Morbidity and Mortality Weekly Report found that from May to September 2023, daily rates of emergency department visits due to heat-related illnesses peaked in a number of regions during warm-weather months and remained elevated for an extended period afterward.
“Heat-related illness will continue to be a significant public health concern as climate change results in longer, hotter, and more frequent episodes of extreme heat,” the study’s authors noted. “By monitoring heat-related health impacts, public health agencies can detect trends in health care utilization rates, identify subpopulations at increased risk, and guide public health actions tailored to specific heat exposure levels.”
How does the dashboard work?
The New York State Heat Risk and Illness Dashboard uses weather data from the National Weather Service and the state’s own early warning weather detection system. It also publishes recent data on heat-related emergency department visits and emergency medical services calls, drawn from statewide syndromic surveillance system reports. The dashboard grew out of HeatRisk, a NWS tool that launched nationwide last spring and combines weekly weather forecasts with predictions for the risk of heat-related health impacts.
New York’s dashboard shows a county-by-county map colored to show heat risk, ranging from “little to no” risk of heat-related illnesses to “extreme” risk. Each risk category offers corresponding recommendations for the public. At the level of “minor” risk, people who are extremely sensitive to heat, like older adults with underlying health conditions, are urged to take breaks and drink fluids; at “moderate” risk, those sensitive to heat and healthy individuals working or playing outdoors should take more frequent breaks and drink plenty of fluids; at “major” risk, everyone should take breaks and drink fluids, and those sensitive to heat should adjust activities; and at “extreme” risk, conditions are dangerous for everyone, meaning that activities should be adjusted, health symptoms monitored, and more time spent in air conditioning.
As of Friday, every county in the state was deemed to be at “little to no” risk of heat-related illnesses, with only Richmond County (Staten Island), deemed at “minor” risk. But by Wednesday, the forecast showed, all of the state could fall under a “minor” risk category, with some counties in Western New York under a “moderate” risk for heat-related illnesses.
How can this tool help us understand heat risk?
State health officials and researchers hope that the dashboard will help inform New Yorkers of their health risks during periods of elevated temperatures and guide local responses to heat waves.
While there is annual variation in weather, longer-term climate trends suggest that New York is getting warmer, said Dr. Neil A. Muscatiello, director of the Bureau of Environmental and Occupational Epidemiology at the Health Department’s Center for Environmental Health.
“In terms of long-term trends, we expect to see more days forecasted in the red and magenta categories — the major and extreme risk categories,” he said.
The launch of the state’s dashboard coincided with the publication of a study in the CDC’s MMWR, which assessed the value of HeatRisk forecasts for New York state.
The study, led by Muscatiello and other Health Department staffers, tracked HeatRisk forecasts for 57 New York counties — excluding those in New York City — from May to September 2024. Researchers found that for New York state and for six of seven state regions, a higher risk forecast was associated with higher rates of heat-related illnesses.
Muscatiello, the study’s lead author, said the findings helped establish that when the HeatRisk forecast suggested higher heat risks, that was reflected in actual emergency department data the next day.
“The forecast could provide a basis for developing heat emergency plans at the local levels,” he said.
What about heat surveillance for New York City?
The state’s new dashboard focuses on counties outside of New York City for health-related data, because when it comes to heat-related illnesses, New York City has its own databases to rely on.
The city tracks real-time heat-related illnesses using syndromic surveillance reports from hospitals in the city, and publishes data on temperatures and ED visits for heat-related illnesses. The city also maintains a “heat vulnerability index,” which shows neighborhoods where residents have heightened risk of dying during and immediately following extreme heat, based on factors like daytime summer surface temperature, access to air conditioning, the availability of green space, and residents’ median income.
The city is particularly vulnerable to the health effects of extreme heat because of the urban heat island effect, which describes how a city’s buildings, roads and infrastructure drive up its overall temperature. Even within New York City, there can be micro heat islands, where temperatures are even higher in neighborhoods with histories of disinvestment and less green space, experts told Healthbeat last year.
Eliza Fawcett is a reporter covering public health in New York City for Healthbeat. Contact Eliza at efawcett@healthbeat.org.